
Infographics
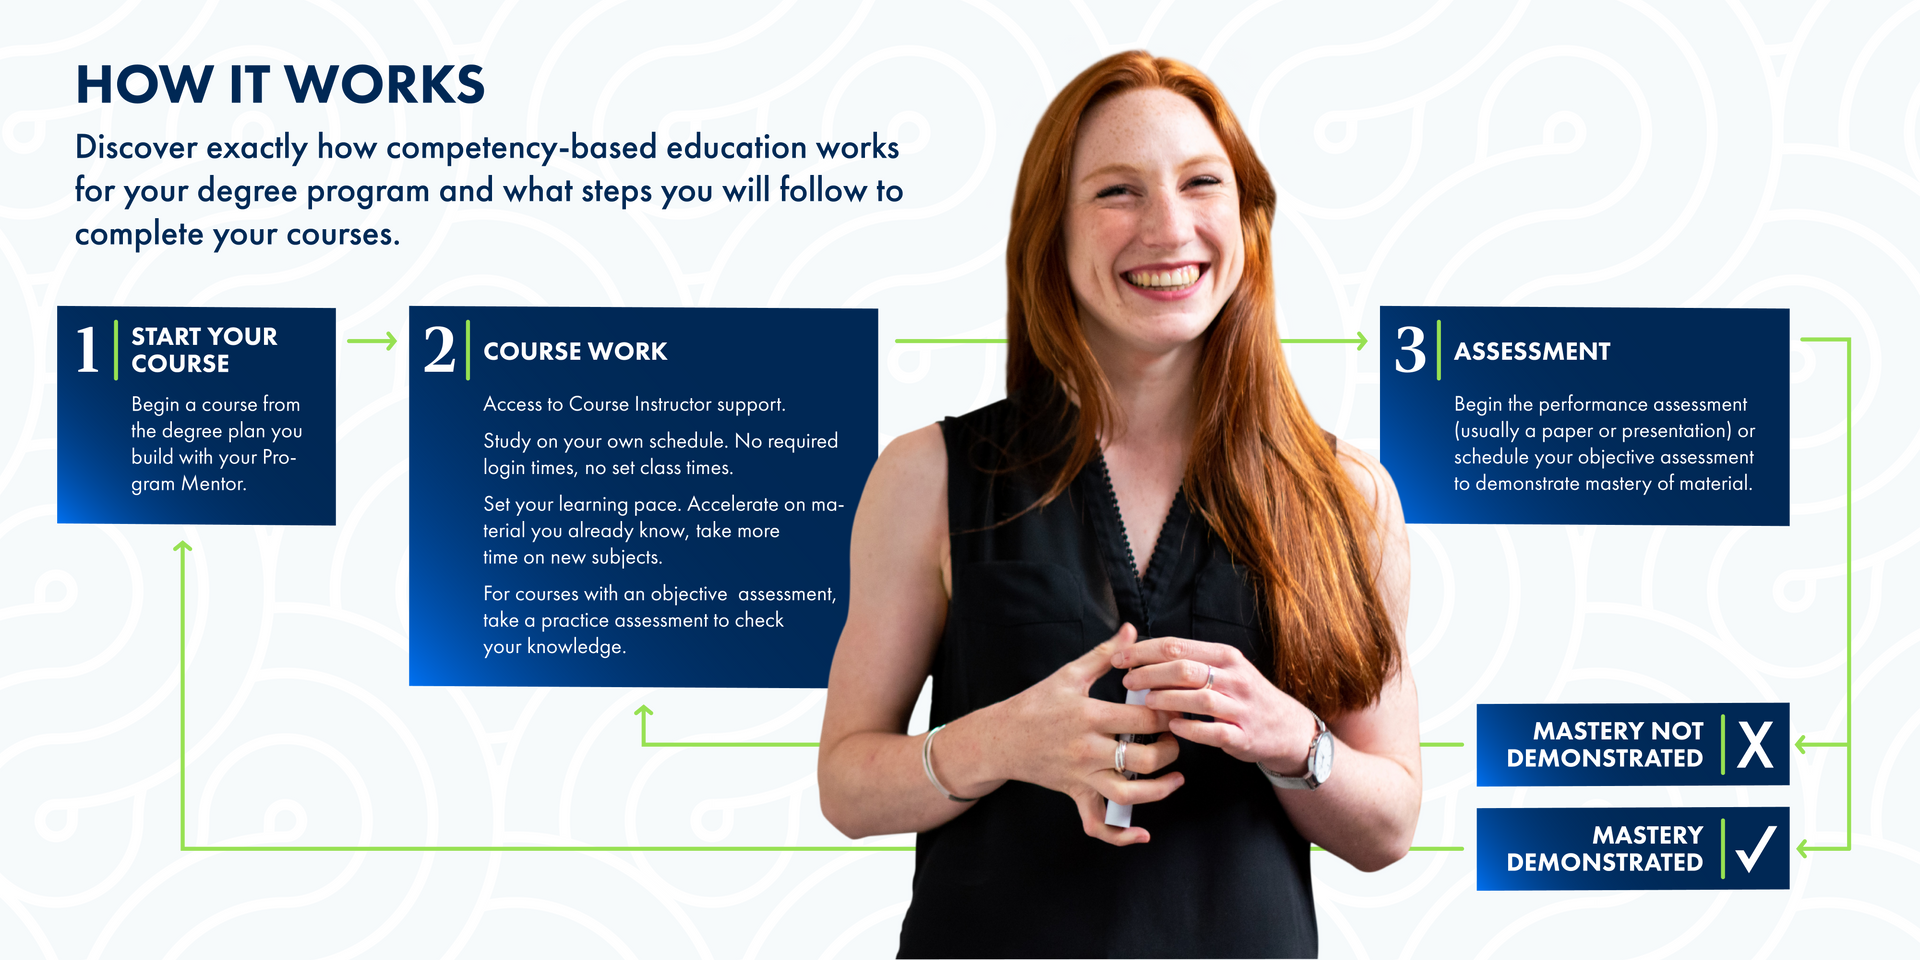
Infographics are powerful tools for visual storytelling, designed to present information clearly and engagingly. WGU graphics are available in three colorways to support variety, clarity, and accessibility. The available styles include bar charts, pie charts, percentage comparisons, timelines, and flowcharts. These infographics spotlight key statistics and insights effectively. They are used selectively across assets like flyers and the WGU website. Infographics built from our datasets are available in both static and animated formats in the DAM. For special requests, please contact the Brand Team.Our infographics are essential tools for visual storytelling, designed to present information clearly and engagingly. Graphics are available in three colorways for variety and readability. Our range includes bar charts, pie charts, percentage comparisons, timelines, and flow charts. The creative team develops these infographics to highlight key statistics effectively. They are used moderately on assets like flyers and our website. Infographics built with our datasets are available in both static and animated forms in the DAM. For special requests, please contact the Brand Governance Team.
Download New Stats and Graphics
AaBb
Futura Pt for descriptions
Our brand font, Futura PT, is the font choice for body text, sentences, and titles in our infographics. Futura PT maintains a well-balanced and easy-to-read format in all its weights. Depending on the chart type, some infographics may utilize all-caps typography.
1234
Rocky for Numbers
Our chosen font for numerical data is "Rocky." Its elevated and professional serif style ensures that our data points stand out. It's important to note that this font is exclusively reserved for displaying isolated numbers, and is never used for any other purpose.

Vertical Graphs

Horizontal Graphs
pie charts

timeline

Slide title
Write your caption hereButton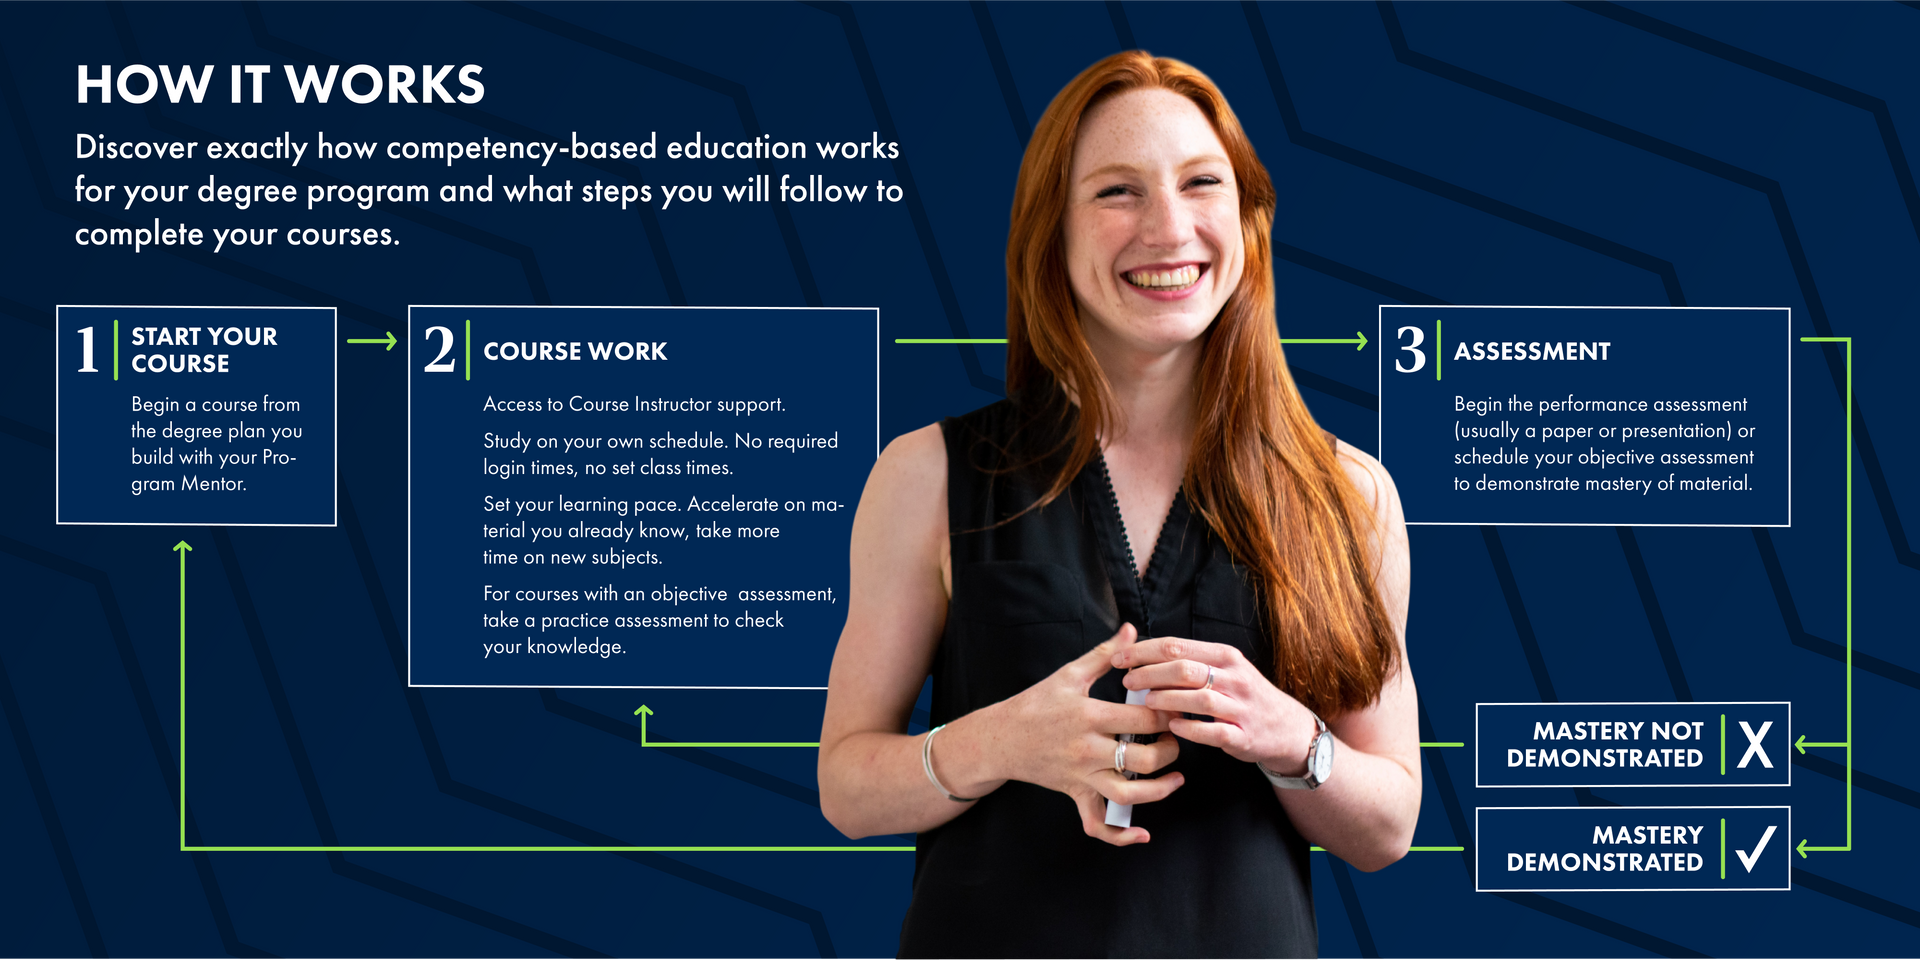
Slide title
Write your caption hereButton
infographics

Slide title
Write your caption hereButton
Slide title
Write your caption hereButton